Y-gRaph: An OpenOffice application to reconstruct paleostress fields from striated faults
Calvín, P. ; Santolaria, P. (Universidad de Zaragoza) ; Tierz, P. ; Muñoz, A. (Universidad de Zaragoza) ; Casas, A. (Universidad de Zaragoza) ; Arlegui, L. (Universidad de Zaragoza) ; Zapata, M. A. (Universidad de Zaragoza)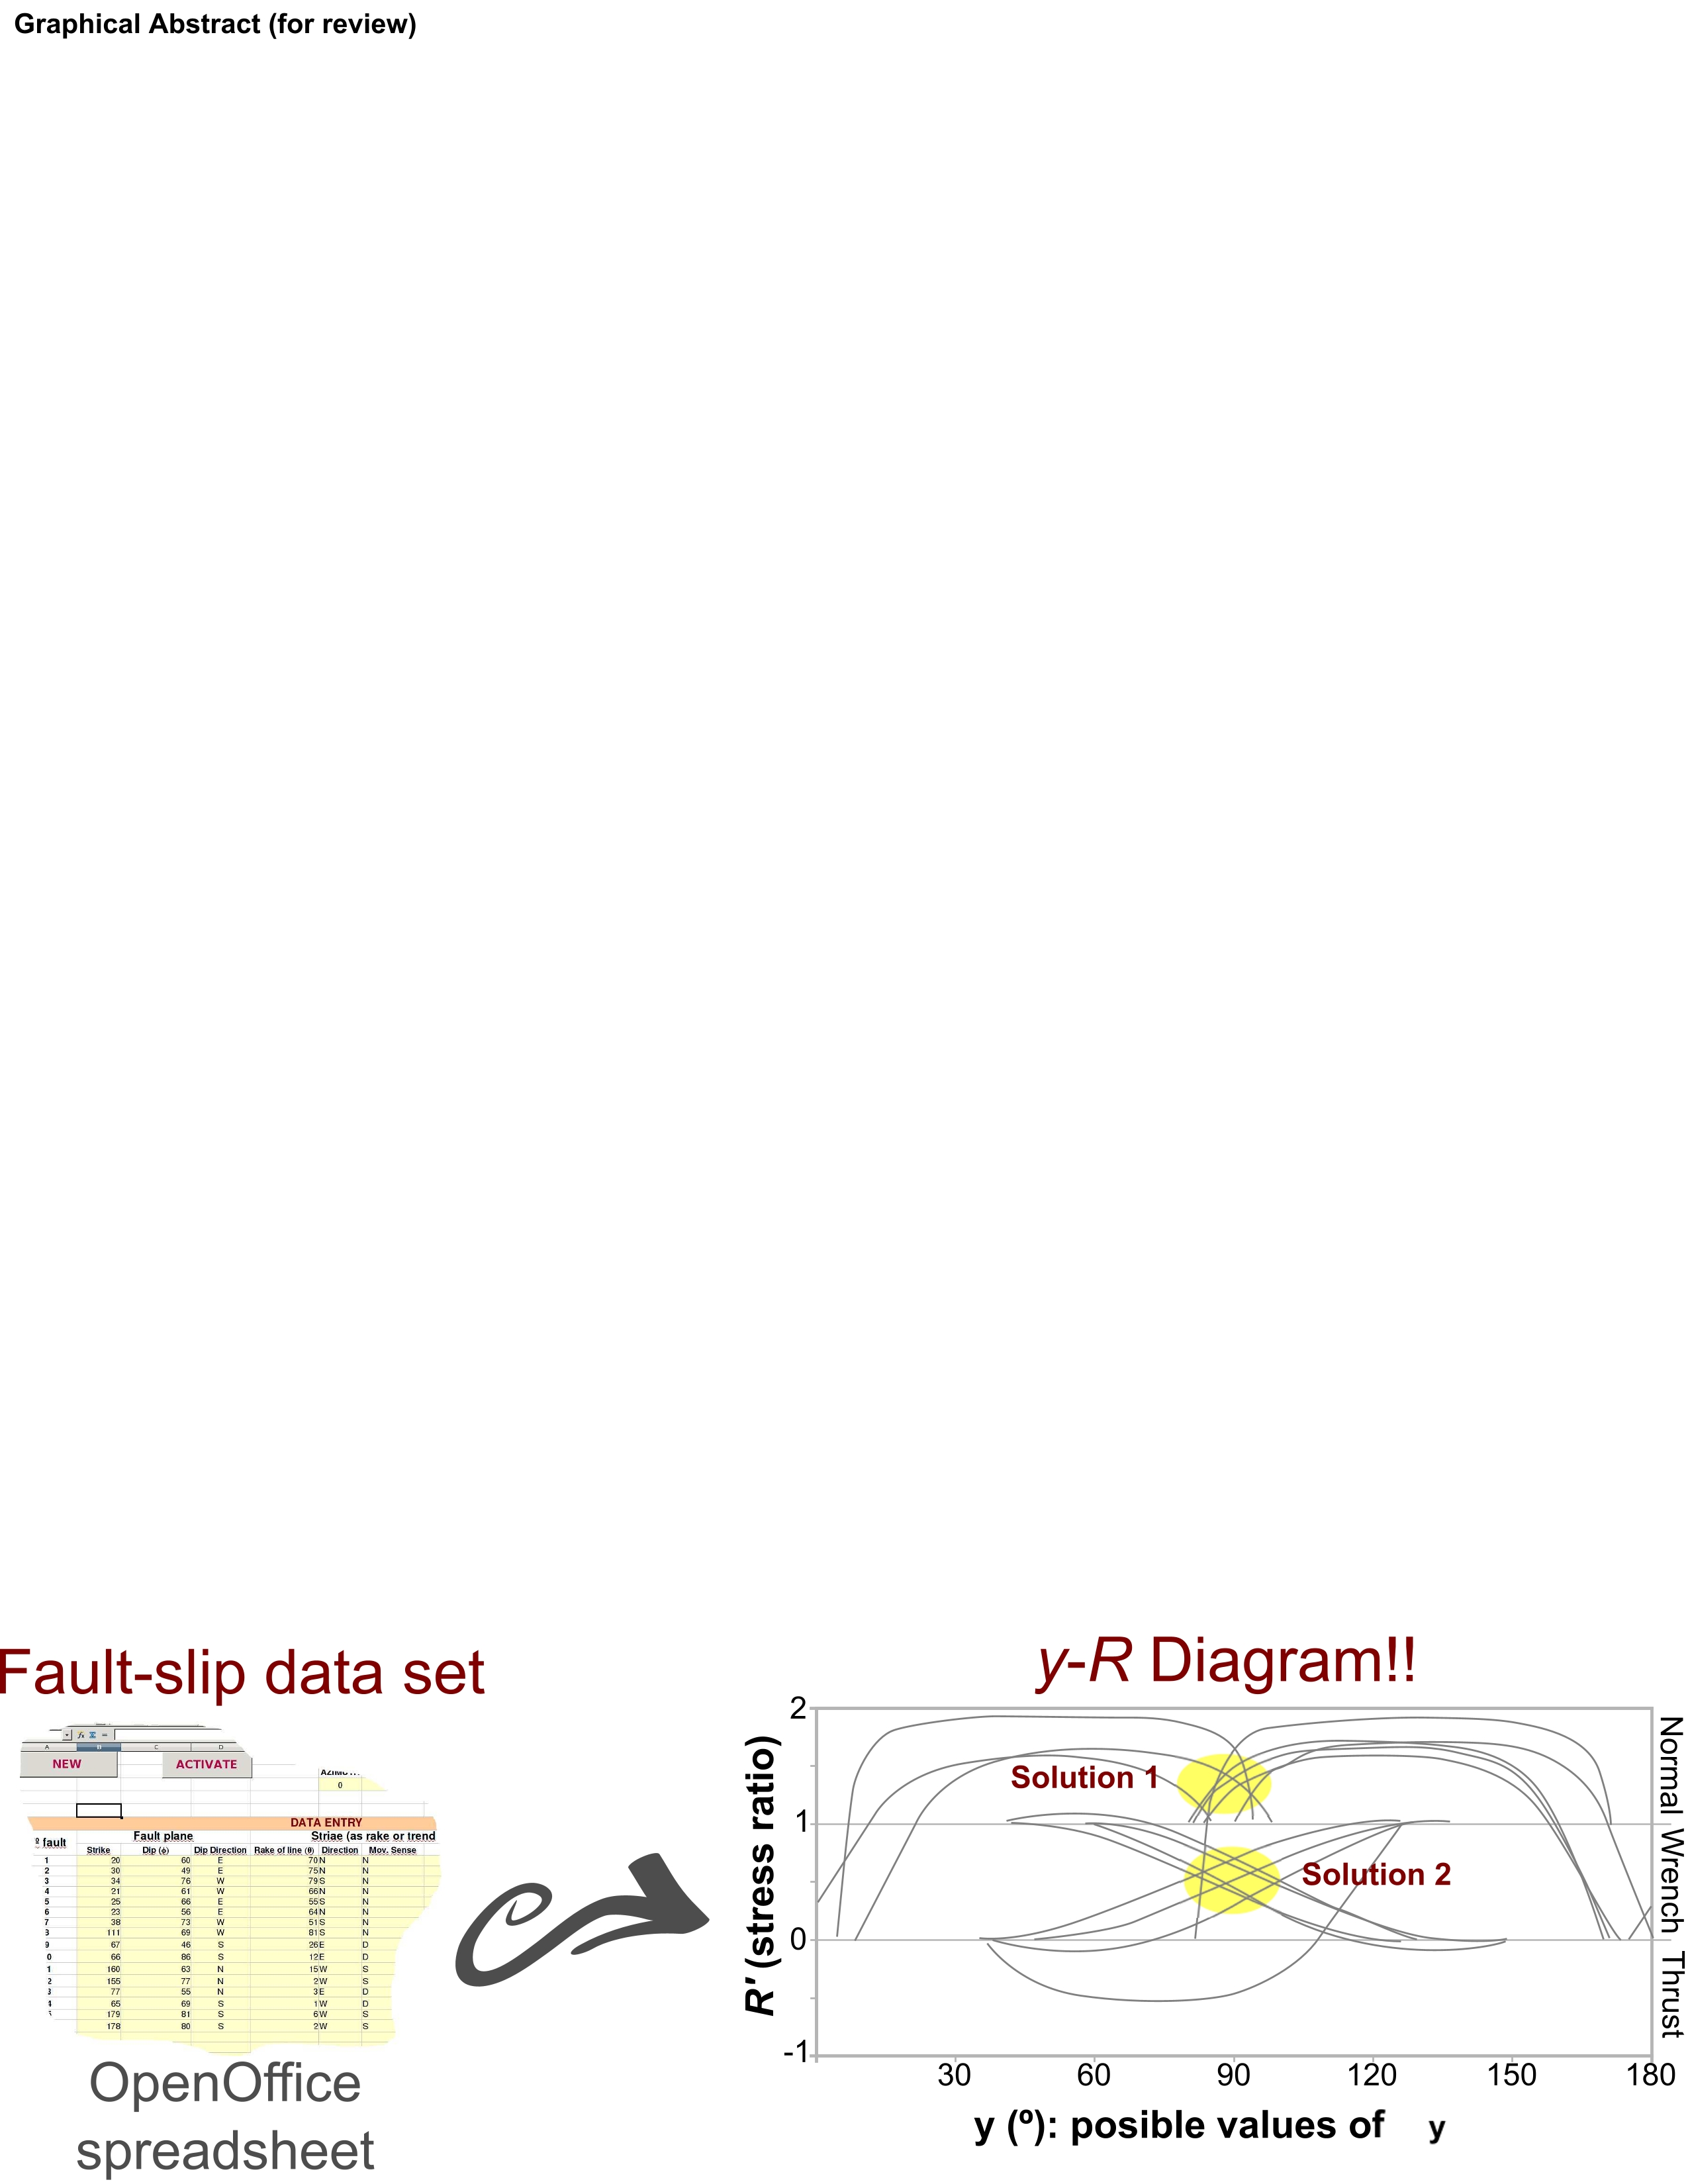
Resumen: y-gRaph, a user-friendly spreadsheet for reconstructing paleostress fields by means of the y–R diagram is presented. The y–R diagram is based on Bott׳s equation and translates the parameters of the stress ellipsoid to a XY plot representing the maximum horizontal stress orientation (σy) and the stress ratio (R), compatible with a given set of striated faults. In cases where several stress tensors fit the dataset, y-R diagram aids in visualizing unrealistic solutions or changes in the stress field with time. Furthermore, the spreadsheet allows to rotate planes and lines, thus simplifying the work with tilted fault populations. Histograms and rose diagrams showing the strike of faults and the trend of striae complement the y-gRaph main output. The application was built using Apache OpenOffice software and supports a variety of input data formats: (i) strike, dip and dip direction (SDD), (ii) azimuth and dip (AD) according to the “Right-hand rule”, and (iii) dip and dip direction (DD).
Idioma: Inglés
DOI: 10.1016/j.cageo.2014.02.008
Año: 2014
Publicado en: COMPUTERS & GEOSCIENCES 67 (2014), 24-30
ISSN: 0098-3004
Factor impacto JCR: 2.054 (2014)
Categ. JCR: COMPUTER SCIENCE, INTERDISCIPLINARY APPLICATIONS rank: 25 / 102 = 0.245 (2014) - Q1 - T1
Categ. JCR: GEOSCIENCES, MULTIDISCIPLINARY rank: 64 / 175 = 0.366 (2014) - Q2 - T2
Tipo y forma: Artículo (PostPrint)
Área (Departamento): Área Historia del Arte (Dpto. Historia del Arte)
Área (Departamento): Área Geodinámica Interna (Dpto. Ciencias de la Tierra)
Área (Departamento): Área Ciencia Comput.Intelig.Ar (Dpto. Informát.Ingenie.Sistms.)
 Derechos reservados por el editor de la revista
Exportado de SIDERAL (2026-04-22-08:40:03)
Visitas y descargas
Idioma: Inglés
DOI: 10.1016/j.cageo.2014.02.008
Año: 2014
Publicado en: COMPUTERS & GEOSCIENCES 67 (2014), 24-30
ISSN: 0098-3004
Factor impacto JCR: 2.054 (2014)
Categ. JCR: COMPUTER SCIENCE, INTERDISCIPLINARY APPLICATIONS rank: 25 / 102 = 0.245 (2014) - Q1 - T1
Categ. JCR: GEOSCIENCES, MULTIDISCIPLINARY rank: 64 / 175 = 0.366 (2014) - Q2 - T2
Tipo y forma: Artículo (PostPrint)
Área (Departamento): Área Historia del Arte (Dpto. Historia del Arte)
Área (Departamento): Área Geodinámica Interna (Dpto. Ciencias de la Tierra)
Área (Departamento): Área Ciencia Comput.Intelig.Ar (Dpto. Informát.Ingenie.Sistms.)
Exportado de SIDERAL (2026-04-22-08:40:03)
Enlace permanente:
Visitas y descargas
Este artículo se encuentra en las siguientes colecciones:
Artículos > Artículos por área > CC. de la Computación e Inteligencia Artificial
Artículos > Artículos por área > Geodinámica Interna
Artículos > Artículos por área > Historia del Arte
Registro creado el 2026-02-19, última modificación el 2026-04-22